
Direction : Study the followings pie-charts carefully and answer the questions given below:


2) How many student did quality from Bihar and UP together?
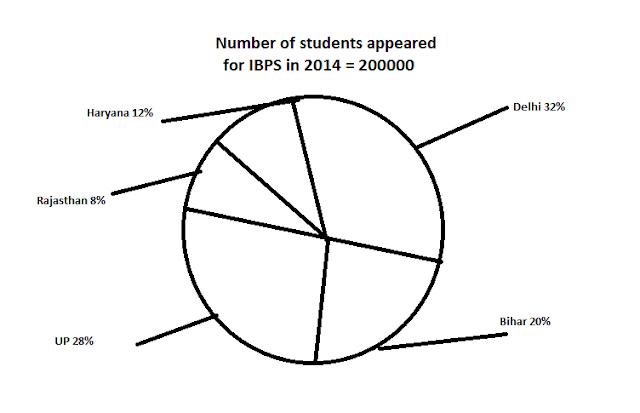
The pie-chart given below represents the number of students appeared for IBPS from different states.
1. The number of candidates qualified from Haryana was what per cent of the number of candidates appeared from Rajasthan?
1) 32%
2) 38%
3) 40%
4) 36%
5) 30%
2) How many student did quality from Bihar and UP together?
1) 20400
2) 24800
3) 25200
4) 22800
5) 24200
3. In which of hte following states, is the number of qualified candidates the minimum?
1) Delhi
2) Bihar
3) UP
4) Haryana
5) Rajasthan
4. What is the ratio of hte number of students appeared from UP to the number of students qualified from Delhi?
1) 175:64
2) 170:64
3) 175:63
4) 173:63
5) 171:64
5. The average number of students qualified from all the states together is:
1) 11208
2) 11248
3) 11348
4) 11608
5) 11448
Answer:
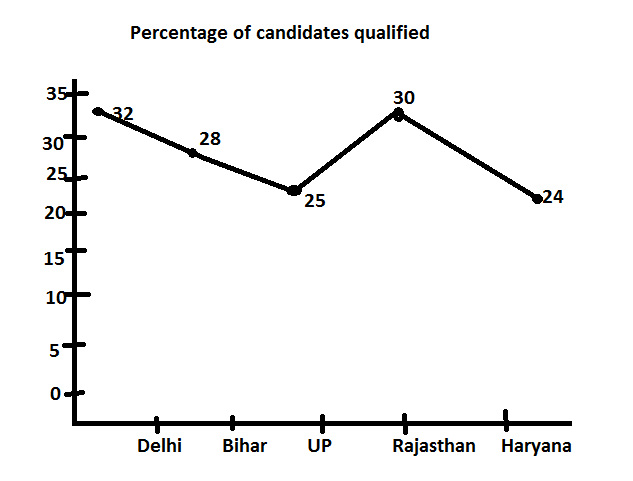
| State | Apeared | Qualified |
| Delhi | 32 x 2000= 64000 | 32 x 640 = 20480 |
| Bihar | 20 x 2000 = 40000 | 28 x 400 = 11200 |
| UP | 28 x 2000 = 56000 | 25 x 560 = 14000 |
| Rajasthan | 8 x 2000 = 16000 | 30 x 160 = 4800 |
| Haryana | 12 x 2000 = 24000 | 24 x 240 = 5760 |
1. 4: Required percentage = x 100 = 36%
2. 3: Total number of students qualified from Bihar and UP together
= 11200 + 14000 = 25200
4. 1: Required ratio = 56000:20480 = 175:64
5. 2: Required average
= 11200 + 14000 = 25200
3. 5: Rajasthan
4. 1: Required ratio = 56000:20480 = 175:64
5. 2: Required average
= 11248

