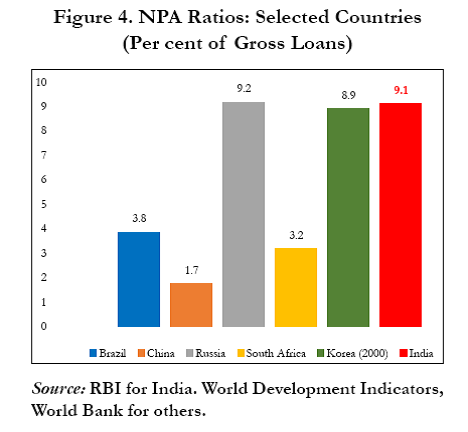

| Country | Brazil | China | Russia | South Africa | Korea | India |
|---|---|---|---|---|---|---|
| Gross Loans (Lakh Crore) |
75 | 105 | 88 | 85 | 80 | 102 |
Question 1.
The ratio between non-performing assets of India and China is :
(a) 21:5
(b) 26:5
(c) 17:21
(d) 5: 13
(e) none of these
(a) 62.5%
(b) 65%
(c) 70%
(d) 58%
(a) 85.3
(b) 94.5
(c) 89.16
(d) 92.4
(e) none of these
(a) 216,200
(b) 268,400
(c) 324,100
(d) 442,300
(e) none of these
(a) 92%
(b) 118%
(c) 154%
(d) 138%
(e) none of these
Data Interpretation Practice Set for RBI Grade B - Part 2
(a) 21:5
(b) 26:5
(c) 17:21
(d) 5: 13
(e) none of these
Question 2.
The non-performing assets of china is approximately what percent of non-performing assets of South Africa:(a) 62.5%
(b) 65%
(c) 70%
(d) 58%
Question 3.
Find the average of total gross loans of all the six countries is (in lakh Cr):(a) 85.3
(b) 94.5
(c) 89.16
(d) 92.4
(e) none of these
Question 4.
The difference between non-performing assets of Korea and India is (in crore):(a) 216,200
(b) 268,400
(c) 324,100
(d) 442,300
(e) none of these
Question 5.
The non-performing assets of Brazil and Russia together is what percentage of non-performing assets of India:(a) 92%
(b) 118%
(c) 154%
(d) 138%
(e) none of these
Data Interpretation Practice Set for RBI Grade B - Part 2
Solutions
Ans. 1. (b)
The ratio between non-performing assets of India and China

Ans. 2. (b)
Ans. 3. (c)
The average of total gross loans of all the six countriesAns. 4. (a)
Non-performing assets of Korea = 80×8.9%non-performing assets of India = 102×9.1 %
Ans. 5. (b)
The non-performing assets of Brazil and Russia together= (75×3.8+9.2×88)%The non-performing assets of India = 102×9.1%
Multiplying factor(M.F.)
⇒ Percentage= 1.179×100= 117.9=118 approx.


