

Data interpretation is one of the most time consuming yet full marking questions if you have interpreted the question rightly. To start with Pie-charts, we should have our hand full with the tricks involving percentage and ratio because at the end of the day the entire portion of Data Interpretation relies upon these two.
If you have the tricks well and good, if not, not to worry we will take a quick look into the topic. Let us first begin with percentage.
Percentages
A percent is a number that represents the fractional part out of 100 (per cent literally means per one hundred). Thus 94% means
For future reference and to make your calculations faster, go through this table thoroughly.
The best and faster way of calculating percentage in exams is by dividing it into parts of fractions that are easy for us to calculate.
For example – To determine 62% of 740,
10% of a number is easiest to find, diving a number by 10.
Now, we fragment 62 as (60 + 2). To determine 60% just calculate 10% and multiply it by 6.

The two, when added, gives 458.8 (62%).
You can also fragment 62% as (50 + 10 + 2). Whichever you find easy.
Similarly,
1. 28% of 450 = (20 + 8) % of 450
2. 83.33% of 72 = (50 + 33.33) % of 72.
For future reference and to make your calculations faster, go through this table thoroughly.
| 1/1 | 100% |
| 1/2 | 50% |
| 1/3 | 33.33% |
| 1/4 | 25% |
| 1/5 | 20% |
| 1/6 | 16.66% |
| 1/7 | 14.28% |
| 1/8 | 12.5% |
| 1/9 | 11.11% |
| 1/10 | 10% |
| 1/11 | 9.09% |
The best and faster way of calculating percentage in exams is by dividing it into parts of fractions that are easy for us to calculate.
For example – To determine 62% of 740,
10% of a number is easiest to find, diving a number by 10.
Now, we fragment 62 as (60 + 2). To determine 60% just calculate 10% and multiply it by 6.

The two, when added, gives 458.8 (62%).
You can also fragment 62% as (50 + 10 + 2). Whichever you find easy.
Similarly,
1. 28% of 450 = (20 + 8) % of 450
2. 83.33% of 72 = (50 + 33.33) % of 72.
Another property of percentage is as:
a% of b = b% of aLet us try understanding this with an example
72% of 225 is?
In this case, we fragment 72 as (70 + 2) to get the answer or some other way.
Instead 225% of a number can be calculated orally and in fraction of seconds.
So we calculate 225% of 72.
200% is double of the number. So double of 72 is 144.

and 144 + 18 = 162.
Wasn’t that easy!
Try this: Determine 42% of 66.66?
Hint: refer to the table for 66.66%.
You can use these tricks to make the calculations faster in Data Interpretation questions.
Let us now talk about Data Interpretation.
Data Interpretation
When the numerical data is represented in the form of various types of graphs to make the data easy to comprehend visually.
The various types of graphs using which data is represented are:
- Tables
- Bar Graphs
- Line Graphs
- Pie Charts
- Radar Graph
We will be discussing here today about PIE CHARTS.
Pie Chart
A pie chart is a type of graph in which a circle is divided into sectors that each represents a proportion of the whole.
A pie-chart looks like,
 Where each sector represents some numerical data which we need for our calculation.
Let us explore this further using a question just like the one asked in the examinations.
A pie-chart looks like,

Let us explore this further using a question just like the one asked in the examinations.
Set 1
Question:
The following pie-chart shows the percentage distribution of the expenditure incurred in publishing a book. Study the pie-chart and the answer the questions based on it.
Various Expenditures (in percentage) Incurred in Publishing a Book

Solution: Before moving on to the questions, I suggest that you take a couple seconds to understand clearly what the graph is trying to say. This will not only increase your accuracy but also save you the trouble of interpreting the data over and over again before solving every question.
Q 1: If for a certain quantity of books, the publisher has to pay Rs. 30,600 as printing cost, and then what will be amount of royalty to be paid for these books?
A. Rs. 19, 450
B. Rs. 21, 200
C. Rs. 22, 950
D. Rs. 26, 150
Solution:
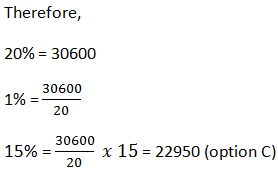
As we can in the graph, the percentage of printing cost is 20% and the value of that 20% in the question is provided to us as 30,600.
The royalty percentage in the graph is 15%.
The royalty percentage in the graph is 15%.
Q 2: What is the central angle of the sector corresponding to the expenditure incurred on Royalty?
A. 15°
B. 24°
C. 54°
D. 48°
Solution:
Royalty percentage = 15% out of 100%
To determine the central angle, the calculation is to be done as follows,

Q 3: The price of the book is marked 20% above the C.P. If the marked price of the book is Rs. 180, then what is the cost of the paper used in a single copy of the book?
A. Rs. 36
B. Rs. 37.5
C. Rs. 42
D. Rs. 44.25
Solution: Price is marked 20% above Cost Price.
Therefore,
If Cost Price = 100%
Marked Price = 120%
The value of Marked Price (120%) is provided to us in the question as 180.
Also, the Paper cost in the graph is 25%.
So, the equation becomes,

Q 4: If 5500 copies are published and the transportation cost on them amounts to Rs. 82500, then what should be the selling price of the book so that the publisher can earn a profit of 25%? A. Rs. 187.50
B. Rs. 191.5
C. Rs. 175
D. Rs. 180

Q 5: Royalty on the book is less than the printing cost by:
A. 5%
B. 33 1/5 %
C. 20 %
D. 25 %
Solution: Royalty percentage = 15%
Printing Cost percentage = 20%

Q 6: If the difference between the two expenditures is represented by 18o in the pie-chart, then these expenditures possibly are
A. Binding Cost and Promotion Cost
B. Paper Cost and Royalty
C. Binding Cost and Printing Cost
D. Paper Cost and Printing Cost
Solution: The entire circle is of 360૦.
We need to find 18o is what percentage of 360૦, which looks like

Now, let’s check among the options, the difference between the two entities must be 5%.
Binding Cost (20%) and Promotion Cost (10%), difference = 10%
Paper Cost (25%) and Royalty (15%), difference = 10%
Binding Cost (20%) and Printing Cost (20%), difference = 0%
Paper Cost (25%) and Printing Cost (20%), difference = 5%
Which makes, Option D our correct answer.
Q 7: For an edition of 12,500 copies, the amount of Royalty paid by the publisher is Rs. 2, 81,250. What should be the selling price of the book if the publisher desires a profit of 5%?
A. Rs. 152.50
B. Rs. 157.50
C. Rs. 162.50
D. Rs. 167.50
Solution: The total royalty cost on 12500 copies = 281250

According to the graph, the royalty cost accounts to 15%.
15% = 22.5 (as we calculated)
And the publisher wants to earn the profit of 5% which means if the COST PRICE is 100; the SELLING PRICE must be 105.
Therefore, the equation becomes,

Q 8: If for an edition of the book, the cost of paper is Rs. 56250, then find the promotion cost for this edition.
A. Rs. 20, 000
B. Rs. 22, 500
C. Rs. 25, 500
D. Rs. 28, 125
Solution: Paper cost in the graph is 25%.
Value as given in the question = 56250
Which means 25% = 56250.
Promotional cost as per graph is 10%.
So, the equation becomes

Q 9: Which two expenditures together have central angle of 108o?
A. Binding Cost and Transportation Cost
B. Printing cost and Paper Cost
C. Royalty and Promotion Cost
D. Binding Cost and Paper Cost
Solution: The entire circle is of 360o.
We need to find 108o is what percentage of 360o, which looks like

Now, let’s check among the options, the sum of the two entities must be 30%.
Binding Cost (20%) and Transportation Cost (10%), sum = 30%
Printing Cost (20%) and Paper Cost (25%), difference = 45%
Royalty (15%) and Promotion Cost (10%), difference = 25%
Binding Cost (20%) and Paper Cost (25%), difference = 45%
Which makes, Option A our correct answer.
I hope the method of solving a question with one pie-chart is clear.
Why don’t you try this example all by yourself and check the answers.
Set 2

A. 72%
B. 68%
C. 138%
D. 146%
E. None of these
Q 2: What is the respective ratio of the numbers of candidates having CIVIL as specialization to that of candidates with COMPUTER as specialization?
A. 17:19
B. 13:17
C. 17:13
D. 13:19
E. None of these
Q 3: What is the total number of candidates with MECHANICAL, ELECTRICAL and CIVIL as specialization?
A. 4120
B. 3210
C. 3120
D. 3020
E. None of these
Q 4: What is the total number of candidates with COMPUTER not as their specialization?
A. 1020
B. 1140
C. 4980
D. 4860
E. None of these
Q 5: Number of candidates with E & TC as their specialization is what percentage of number of students from ELECTRICAL specialization? A. 91%
B. 81%
C. 123%
D. 102%
E. 109%
Now, we studied the graph where the pie chart was divided based on percentage. One another way a pie-chart can be divided is in DEGREES. Have a look,
Set 3
Question: Refer to the following pie chart and answer the questions that follow.

Where 36 = central angle of division that specifies TIMBER
360 = total central angle
100 = Total percentage
Using this we can find the percentage of TIMBER (out of 100) if required.
Also remember, we need not calculate percentage every time, we can work with degrees and will calculate percentage only if that is the only option. Do not worry the answers won’t differ in the two cases.
Q 1: The amount spent on CEMENT is?
A. Rs. 20,000
B. Rs. 16,000
C. Rs. 12,000
D. Rs. 10,000
E. None of these
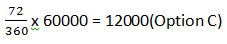
Solution: As the central angle for cement is 72 out of 360,
and the total cost of construction is provided to us which is Rs. 60000
Q 2: The amount spent on LABOUR exceeds the amount spent on STEEL by?
A. 5% of total cost
B. 10% of total cost
C. 12% of total cost
D. 15% of total cost
E. None of these
Solution:

Q 3: The amount spent on CEMENT, STEEL and SUPERVISION is what percentage of total cost of constructions?
A. 40%
B. 45%
C. 50%
D. 55%
E. None of these
Solution: Let us total the central angle for the three given entities.
Cement + steel + supervision = 72 + 54 + 54 = 180
We need to find the percentage and we use the same formula we studied before starting the question,

Q 4: The amount spent on labor exceeds the amount spent on supervision by?
A. Rs. 4500
B. Rs. 5000
C. Rs. 6500
D. Rs. 6000
E. None of these
Solution:

Q 5: Find out the total amount spent on BRICKS, STEEL and SUPERVISION?
A. Rs. 18000
B. Rs. 24000
C. Rs. 27000
D. Rs. 36000
E. None of these
Solution: The central angles for the three are,
Bricks = 54
Steel = 54
Supervision = 54
Total = 54 + 54 + 54 = 162
We need to find the total amount on these three of the total amount on construction (which is 60000).

Yes!! It is this easy. Tad bit of practice and you will be out of the examination hall with a wide smile on your face.
But the story of pie-charts is not over yet. To increase the difficulty level of these problems, the graphs are combined with each other to make one single problem.
E.g. pie-charts with tables, tables with bar graphs etc, there could be ‘n’ number of combinations. The simplest solution is to be prepared for everything that comes our way.
Let us not waste any more of our precious time and move on to some more examples of the miscellaneous types of graphs and understand it all practically.
This is an example of pie-chart with table.

Solution: As we can understand from the pie-chart and table above, the pie-chart gives us the total employees in the field and table gives us the females among them.
Q 1: What is the ratio of the male ENGINEERS and DESIGNERS to the same occupation female professionals’ n the town?
A. 41 : 44
B. 55 : 53
C. 31 : 35
D. 44 : 35
E. None of these
Solution: Let’s just work on the percentages rather than numbers.
Female Engineers = 60% of (18% of 10500)
Female Designers = 35% of (16% of 10500)
Now, to find the male employees in the mentioned professions, we subtract the calculated females from total.
Male Engineers = 40% of (18% of 10500)
Male Designers = 65% of (16% of 10500)
Further, the ratio is to be found of MALES to FEMALES,

Not in the given options. Therefore, None of these (Option E)
Q 2: The total no. of LAWYERS in town is approximately what percent of the total number of DOCTORS in the town?
A. 95%
B. 98%
C. 90%
D. 85%
E. 81%
Solution: Since the total is same, we can work only on percentages which should be like,

This is Option C.
Q 3: What is the difference between the total number of male and female professionals in town.
A. 1284
B. 1134
C. 1054
D. 1164
E. None of these
Solution: This question may take a bit of time but using the calculations we have made above we will try and solve it in no time.
The number of males and females in the professions ENGINEERS and DESIGNERS were calculated by us in Q 1 already. Try and use it here.
As of other professions, let’s calculate it here.
For Architects females in the profession are,

The (100 x 100) will be common in all the calculation along with the total (10500). If we take it all common, only the two percentages remain. Not to worry, we will take it into calculation when we are done with the complex part.
Architects = 40% of 11% = 40 x 11 = 440 (Females)
Male Architects = 60% of 11% = 60 x 11 = 660
Teachers = 80% of 15% = 80 x 15 = 1200 (Females)
Male Teachers = 20% of 15% = 20 x 15 = 300
Lawyers = 40% of 19% = 40 x 19 = 760 (Females)
Male Lawyers = 60% of 19% = 1140
Doctors = 20% of 21% = 20 x 21 = 420 (Females)
Male Doctors = 80% of 21% = 80 x 21 = 1680
Filling it all in table to make the visual easy,
To find the total of females and males we add all the data in the above table to find,
Females = 4460
Males = 5540
We need the difference, therefore,
Difference = 5540 – 4460 = 1080
The final equation should look like

Q 4: Female DOCTORS are what percentage of the female TEACHERS in the town?
A. 42%
B. 28%
C. 15%
D. 35%
E. None of these
Solution: we have calculated the data to be found for this question in the above question.
Female Doctors = 420
Female Teachers = 1200
The equation should look like,

Q 5: What is the ratio of the number of male ARCHITECTS to the number of male TEACHERS in the town?
A. 11 : 5
B. 3 : 2
C. 5 : 11
D. 2 : 3
E. None of these
Solution: We have made the calculations already; we just need to use the data we need.
Male Architects = 660
Male Teachers = 300
The final equation should look like,

I hope now that mixed graph are clear to you.
How about you guys solve this problem of a mixed graph and let us know if there’s an issue.


Q 1: What is the sum of the number of girls in School C, the number of girls in School E and the number of boys in School D together?
A. 1700
B. 1900
C. 1600
D. 1800
E. None of these
Q 2: What is the ratio of the number of boys in School C, the number of girls in School B and the total number of students in School E?
A. 45 : 7 : 97
B. 43 : 9 : 97
C. 45 : 7 : 87
D. 43 : 9 : 87
E. None of these
Q 3: What is the difference between the total number of students in School F and the number of boys in School E?
A. 820
B. 860
C. 880
D. 900
E. None of these
Q 4: In which of the following schools is the total number of students equal to the number of girls in School E?
A. A
B. B
C. C
D. D
E. F
Q 5: The number of girls in School A is approximately what percentage of the total number of students in School B?
A. 55%
B. 50%
C. 35%
D. 45%
E. None of these
Hint: As the pie-chart provides percentages while bar-graph works with the numbers here. Let’s make the entire deal with the numbers. So let’s make something like this beforehand and save the trouble.
Total students can be calculated using pie-chart. Boys column can be filled from bar-graph and their difference will fill out the Girls column.
Have fun with the Data Interpretation questions. They are lengthy but save a handful of marks if interpreted correctly.
Hope this one helps you!!
Set 4
Question: Study the following pie-chart and data carefully and answer the questions that follow.
Percentage of female professionals
|
|
Engineers
|
60%
|
Architects
|
40%
|
Teachers
|
80%
|
Lawyers
|
40%
|
Doctors
|
20%
|
Designers
|
35%
|
Solution: As we can understand from the pie-chart and table above, the pie-chart gives us the total employees in the field and table gives us the females among them.
Q 1: What is the ratio of the male ENGINEERS and DESIGNERS to the same occupation female professionals’ n the town?
A. 41 : 44
B. 55 : 53
C. 31 : 35
D. 44 : 35
E. None of these
Solution: Let’s just work on the percentages rather than numbers.
Female Engineers = 60% of (18% of 10500)
Female Designers = 35% of (16% of 10500)
Now, to find the male employees in the mentioned professions, we subtract the calculated females from total.
Male Engineers = 40% of (18% of 10500)
Male Designers = 65% of (16% of 10500)
Further, the ratio is to be found of MALES to FEMALES,
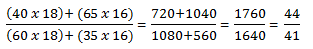
Not in the given options. Therefore, None of these (Option E)
Q 2: The total no. of LAWYERS in town is approximately what percent of the total number of DOCTORS in the town?
A. 95%
B. 98%
C. 90%
D. 85%
E. 81%
Solution: Since the total is same, we can work only on percentages which should be like,

This is Option C.
Q 3: What is the difference between the total number of male and female professionals in town.
A. 1284
B. 1134
C. 1054
D. 1164
E. None of these
Solution: This question may take a bit of time but using the calculations we have made above we will try and solve it in no time.
The number of males and females in the professions ENGINEERS and DESIGNERS were calculated by us in Q 1 already. Try and use it here.
Profession
|
Male
|
Female
|
Engineers
|
720
|
1080
|
Designers
|
1040
|
560
|
As of other professions, let’s calculate it here.
For Architects females in the profession are,

The (100 x 100) will be common in all the calculation along with the total (10500). If we take it all common, only the two percentages remain. Not to worry, we will take it into calculation when we are done with the complex part.
Architects = 40% of 11% = 40 x 11 = 440 (Females)
Male Architects = 60% of 11% = 60 x 11 = 660
Teachers = 80% of 15% = 80 x 15 = 1200 (Females)
Male Teachers = 20% of 15% = 20 x 15 = 300
Lawyers = 40% of 19% = 40 x 19 = 760 (Females)
Male Lawyers = 60% of 19% = 1140
Doctors = 20% of 21% = 20 x 21 = 420 (Females)
Male Doctors = 80% of 21% = 80 x 21 = 1680
Filling it all in table to make the visual easy,
Profession
|
Females
|
Males
|
|---|---|---|
Engineers
|
1080
|
720
|
Designers
|
560
|
1040
|
Architects
|
440
|
660
|
Teachers
|
1200
|
300
|
Lawyers
|
760
|
1140
|
Doctors
|
420
|
1680
|
To find the total of females and males we add all the data in the above table to find,
Females = 4460
Males = 5540
We need the difference, therefore,
Difference = 5540 – 4460 = 1080
The final equation should look like

Q 4: Female DOCTORS are what percentage of the female TEACHERS in the town?
A. 42%
B. 28%
C. 15%
D. 35%
E. None of these
Solution: we have calculated the data to be found for this question in the above question.
Female Doctors = 420
Female Teachers = 1200
The equation should look like,

Q 5: What is the ratio of the number of male ARCHITECTS to the number of male TEACHERS in the town?
A. 11 : 5
B. 3 : 2
C. 5 : 11
D. 2 : 3
E. None of these
Solution: We have made the calculations already; we just need to use the data we need.
Male Architects = 660
Male Teachers = 300
The final equation should look like,

I hope now that mixed graph are clear to you.
How about you guys solve this problem of a mixed graph and let us know if there’s an issue.
Set 5
Question: Study the following pie-chart and data carefully and answer the questions that follow.
Q 1: What is the sum of the number of girls in School C, the number of girls in School E and the number of boys in School D together?
A. 1700
B. 1900
C. 1600
D. 1800
E. None of these
Q 2: What is the ratio of the number of boys in School C, the number of girls in School B and the total number of students in School E?
A. 45 : 7 : 97
B. 43 : 9 : 97
C. 45 : 7 : 87
D. 43 : 9 : 87
E. None of these
Q 3: What is the difference between the total number of students in School F and the number of boys in School E?
A. 820
B. 860
C. 880
D. 900
E. None of these
Q 4: In which of the following schools is the total number of students equal to the number of girls in School E?
A. A
B. B
C. C
D. D
E. F
Q 5: The number of girls in School A is approximately what percentage of the total number of students in School B?
A. 55%
B. 50%
C. 35%
D. 45%
E. None of these
Hint: As the pie-chart provides percentages while bar-graph works with the numbers here. Let’s make the entire deal with the numbers. So let’s make something like this beforehand and save the trouble.
| School | Total students | Boys | Girls |
Total students can be calculated using pie-chart. Boys column can be filled from bar-graph and their difference will fill out the Girls column.
Have fun with the Data Interpretation questions. They are lengthy but save a handful of marks if interpreted correctly.
Hope this one helps you!!

