

The graph given below represents the production (in tonnes) and sales ( in tonnes) of a company from 2009-2014

The table given below represents the ratio of the production (in tonnes) by company A to the production (in tonnes) by company B; and the ratio of the sales ( in tonnes) by company A to the sales (in tonnes) by company B.
Year
|
Production
|
Sales
|
|---|---|---|
2009
|
9:8
|
2:3
|
2010
|
8:7
|
11:15
|
2011
|
5:9
|
4:7
|
2012
|
15:11
|
3:7
|
2013
|
5:3
|
7:5
|
2014
|
12:13
|
1:1
|
1) What is the approximate percentage increase in the production of company A from the year 2012 to the production of company A in the year 2013?
1. 33%
2. 30%
3. 36%
4. 26%
5. 28%
2) What is the average production of company B (in tonnes) from the year 2009 to the year 2014?
1. 368
2. 362.5
3. 378.5
4. 372.5
5. 376
3) The sales of company A in the year 2012 was approximately what percent of the production of company A in the same year?
1. 44%
2. 40%
3. 36%
4. 38%
5. 42%
4) What is the ratio of the total production (in tonnes) of company A to the total sales (in tonnes) of company B in all the years together?
1. 161:126
2. 161:125
3. 161:123
4. 169: 126
5. 158: 126
5) What is the average sales of company A from the year 2009 to the year 2014?
1. 254
2. 243
3. 234
4. 256
5. 248
6) What is the ratio of production of company B in the year 2009 to the production of company B in the year 2011?
1. 9:10
2. 6:7
3. 7:8
4. 5:6
5. 8:9
7) What was the approximate percentage more in the production of company B in the year 2014 as compared with the production of Company A in the year 2014?
1. 6%
2. 7%
3. 8%
4. 10%
5. 12%
Answer:
1) 1;
Production of company A in 2012
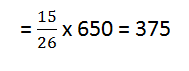
Production of company A in 2013

∴ Required percentage increase

2) 4;
Required average

3) 2;
Required percentage

4) 1;
Total production of company A in all the years together
 = 450 + 480 + 250 + 375 + 500 + 360 = 2415
Total sales of company B
= ( 240 + 375 + 350 + 350 + 250 + 325) = 1890
∴ Required ratio = 2415 : 1890 = 161:126
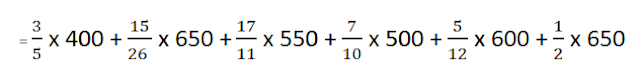
5) 2;
Average sales of company A

5) 2;
Average sales of company A
6) 5;
Required ratio
= 400 : 450 = 8:9
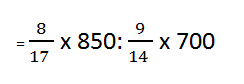
7) 3;
Required percentage increase

= 8.3% = 8%
