Directions (1-8): Study the following graph carefully and answer the questions given below:
The line graph represents the percentage candidates qualifies in a competitive examination from 6 states during the given two years.
 The table given below represents the total number of candidates appeared, percentage of candidates qualified in all the six states together in the year 2013 and 2014.
The table given below represents the total number of candidates appeared, percentage of candidates qualified in all the six states together in the year 2013 and 2014.
Year
|
Appeared
|
Qualified
|
2013
|
1,42,000
|
45%
|
2014
|
1,80,000
|
52%
|
Ratio of male to the female candidates qualified from different states in both the years.
State
|
2013
|
2014
|
S₁
|
5:4
|
28:17
|
S₂
|
3:1
|
5:3
|
S₃
|
7:5
|
11:5
|
S₄
|
13:11
|
15:11
|
S₅
|
13:12
|
15:9
|
S₆
|
8:1
|
11:9
|
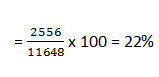
1. The number of female candidates qualified from state S₂ in 2013 is approximately what per cent of the male candidates qualified from S₁ in 2014?
1. 16%
2. 22%
3. 20%
4. 14%
5. 18%
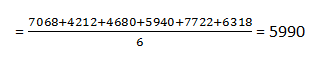
2. If in 2014 in state S₁ four female candidates qualified are not eligible then what is the average number of female candidates qualified from all the states together in the year 2014?
1. 5990
2. 5900
3. 5920
4. 5940
5. 5960
3. What is the ratio of the number of female candidates qualified from states S₁ and S₃ together in 2013 to the number of male candidates qualified from the same states in the year 2014?
1. 8307:21844
2. 8407:21944
3. 8307:21944
4. 8307:20894
5. 8037:29144
4. What is the average number of candidates qualified from states S₂, S₃, S₄ and S₆ together in the year 2013?
1. 9405.75
2. 9005.75
3. 9105.75
4. 9505.75
5. 9205.75
5. What is the approximate average number of male candidates qualified from all the states together in the year 2013?
1. 6427
2. 6267
3. 6672
4. 6607
5. 6627
6. The number of male candidates qualified from state S₅ in 2014 is what per cent more or less than the number of male candidates qualified from state S₆ in 2013?
1. 72% less
2. 74% more
3. 70% less
4. 76% more
5. 78% more
7. From which of the following states in the year 2013, is the number of female candidates qualified the maximum?
1. S₅
2. S₆
3. S₄
4. S₁
5. S₂
8. From which of the following states in the year 2014, the number of male candidates qualified is minimum?
1. S₄
2. S₁
3. S₅
4. S₂
5. S₃
Download IBPS PO Mains GK Digest here
Answer :
Number of candidates qualified in the year2013 = 45 x 1420 = 63900
2014 = 52 x 1800 = 93600
States
|
2013
|
2013
|
2014
|
2014
|
||
Qualified
|
M
|
F
|
Qualified
|
M
|
F
|
|
S₁
|
18 x 639 = 11502
|
6390
|
5112
|
20 936 = 18720
|
11648
|
7072
|
S₂
|
16 x 639 = 10224
|
7668
|
2556
|
12 x 936 = 11232
|
7020
|
4212
|
S₃
|
12 x 639 = 7668
|
4473
|
3195
|
16 x 936 = 14976
|
10296
|
4680
|
S₄
|
16 x 639 = 10224
|
5538
|
4686
|
15 x 936 = 14040
|
8100
|
5640
|
S₅
|
25 x 639 = 15975
|
8307
|
7668
|
22 x 936 = 20592
|
12870
|
7722
|
S₆
|
13 x 639 = 8307
|
7384
|
923
|
15 x 936 = 14040
|
7722
|
6318
|
1. 2;
Required percentage
2. 1;
Required average
3. 3;
Required ratio
= 5112 + 3195 : 11648 + 10296
= 8307 : 21944
4. 3;
Required average

5. 5;
Required average

6. 2;
Required percentage more

7. 1
8. 4