

Percentage break up of the number of children in five different villages and break up of children Attending school from those villages


1. What is the total number of children not attending school from village V₂ and V₃ together?
1. 528
2. 508
3. 518
4. 618
5. 628
2. The number of children attending school from village V₁ is approximate, what percent of the number of children from that village?
1. 54%
2. 56%
3. 60%
4. 53%
5. 58%
3. What is the approximate average number of children not attending school from village V₂, V₃ and V₄ together?
1. 269
2. 258
3. 264
4. 270
5. 266
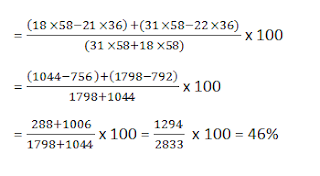
4. The number of children not attending school from village V₄ and V₅ is approximately what percent of the total number of children from village V₄ and V₅ together?
1. 43.65%
2. 42.5%
3. 48%
4. 46%
5. 49.45%
5. What is the ratio of the total number of children from village V₄ to the number fo children attending school from the same village?
1. 22:21
2. 29:28
3. 29:21
4. 29:27
5. 23:21
Answer :
1. 3;
Required answer

= 1392 - 1008 + 638 - 504 = 384 + 134 = 518
2. 5;
Required percentage

3. 1;
Required average
 4. 4. 4;
Required percentage
5. 3;
Required ratio
= 18 x 58 : 21 x 36
= 58 : 42 = 29 : 21
